Blog
Insights
Straightforward interfaces make navigation and actions more intuitive, reducing the learning curve for new users.

Matt Allison
Founder & CEO

Key Takeaways
Modern PR reporting tools have outpaced the dashboards most communications teams are still using.
Half of in-house communications leaders cite an inability to measure impact effectively as one of their biggest professional challenges—yet most are still tracking the same basic metrics they were five years ago.
The most strategic PR dashboards in 2026 combine traditional coverage metrics with narrative-level intelligence, brand-centric sentiment, and share of voice data—all in real time.
LLM perception tracking is emerging as a critical new layer: how AI systems describe your brand now shapes what audiences believe.
If your current media reporting software still delivers a monthly or quarterly clip report, it's already behind the pace of the conversations your brand is part of.
Communications leaders who treat reporting as a strategic function—not a documentation exercise—are building reputations, not just tracking them.
As enterprise communications teams head into 2026, one uncomfortable truth is surfacing at the executive level: most PR reporting tools weren't built for the way brands get covered today. The dashboards many teams rely on were designed for a media environment that no longer exists—one where coverage moved slowly enough for quarterly analysis to matter, and where mentions were a reasonable proxy for reputation.
Today, coverage narratives form and shift in real time, audience perception is shaped as much by AI-generated summaries as by journalists, and the window for influencing a story closes faster than any quarterly cycle allows. The global PR industry is responding, but slowly. The gap between what modern media reporting software can do and what most teams are actually using it for has never been wider.
This guide is for communications leaders who are ready to close that gap—starting with their dashboards.
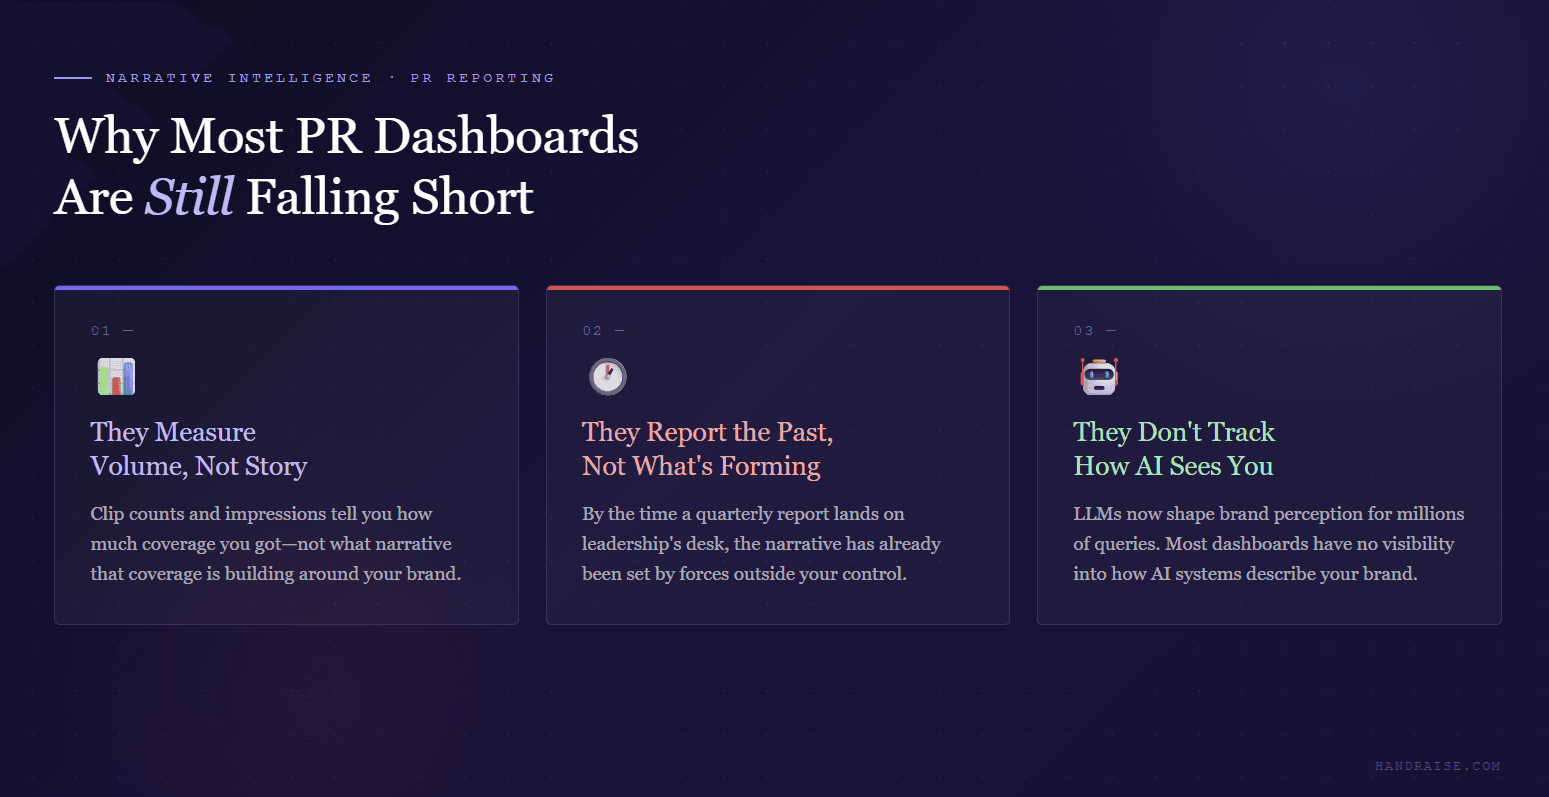
Why Most PR Reporting Dashboards Are Falling Short
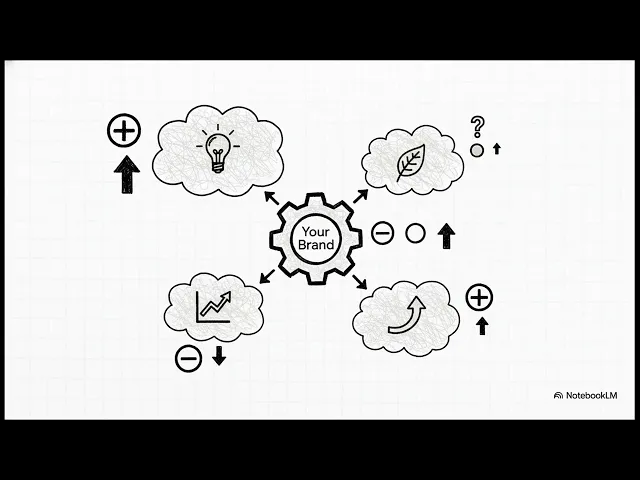
PR dashboards have always been designed to answer one question: what happened? Volume of coverage, reach, impressions, sentiment scores—these are documentation metrics. They tell you what occurred after the fact, neatly packaged for a Monday morning briefing or a quarterly board deck.
The problem is that "what happened" is only useful if you have time to act on it, and in today's media environment, the gap between "what's forming" and "what happened" can be measured in hours, not weeks. By the time the traditional quarterly report is assembled, cleaned, formatted, and presented, the narratives it documents have often already set in the minds of journalists, analysts, and AI systems.
According to the Cision and PRWeek Global Comms Report, 50% of in-house communications leaders cite an inability to measure impact effectively as one of their biggest challenges—and that problem doesn't improve by adding more metrics to the same outdated dashboard.
The Coverage Volume Trap
The most common mistake communications teams make is treating volume metrics—clip counts, impressions, reach—as primary performance indicators. These numbers are easy to generate, easy to visualize, and deeply unsatisfying to any executive who wants to know whether PR is actually moving the needle on brand reputation.
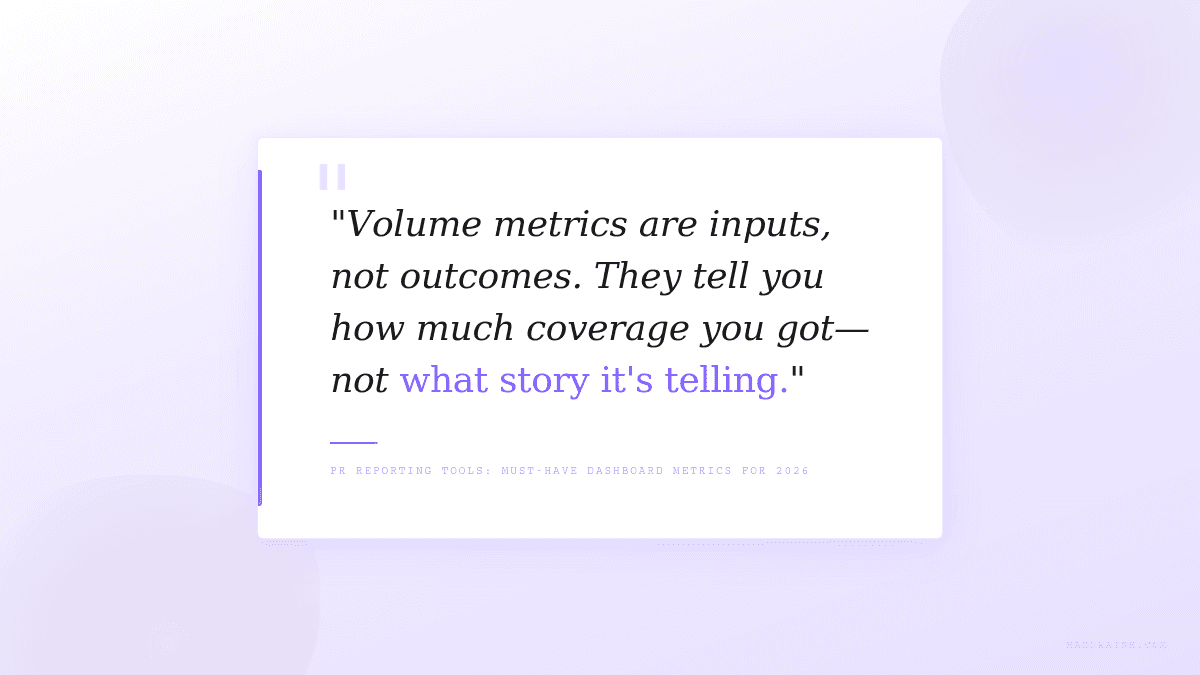
Volume metrics are inputs, not outcomes. They tell you how much coverage you received, not what story that coverage is telling, whether that story is accurate, whether it's gaining or losing momentum, or how it compares to the narratives forming around your competitors. A brand that generates 500 pieces of coverage that collectively reinforce a neutral-to-negative narrative is in worse shape than one with 50 highly influential pieces that consistently reinforce key messages.
The Quarterly Cycle Problem
There's a structural issue baked into how many organizations approach PR reporting: it's designed around internal cadence, not external reality. Monthly digests and quarterly reports make sense for resource planning, budget justification, and board presentations—but they're terrible instruments for reputation management.
A story that mischaracterizes your brand's position on an industry issue doesn't wait for the next reporting cycle to gain traction. A cluster of coverage that subtly associates your brand with a competitor's vulnerability doesn't pause while your team assembles the next executive briefing. Real-time media monitoring that surfaces these patterns as they form—not weeks later—is what separates reactive communications from proactive reputation strategy. AMEC, the global body for communications measurement, reinforces this point: connecting PR outcomes to business impact requires moving beyond activity counts toward intelligence that informs decisions in real time.
What Modern PR Reporting Tools Must Include in 2026
The best executive PR reporting in 2026 doesn't just show more data—it shows the right data, organized around questions that matter strategically. Here's a breakdown of the metrics and capabilities that belong in any serious communications dashboard today.
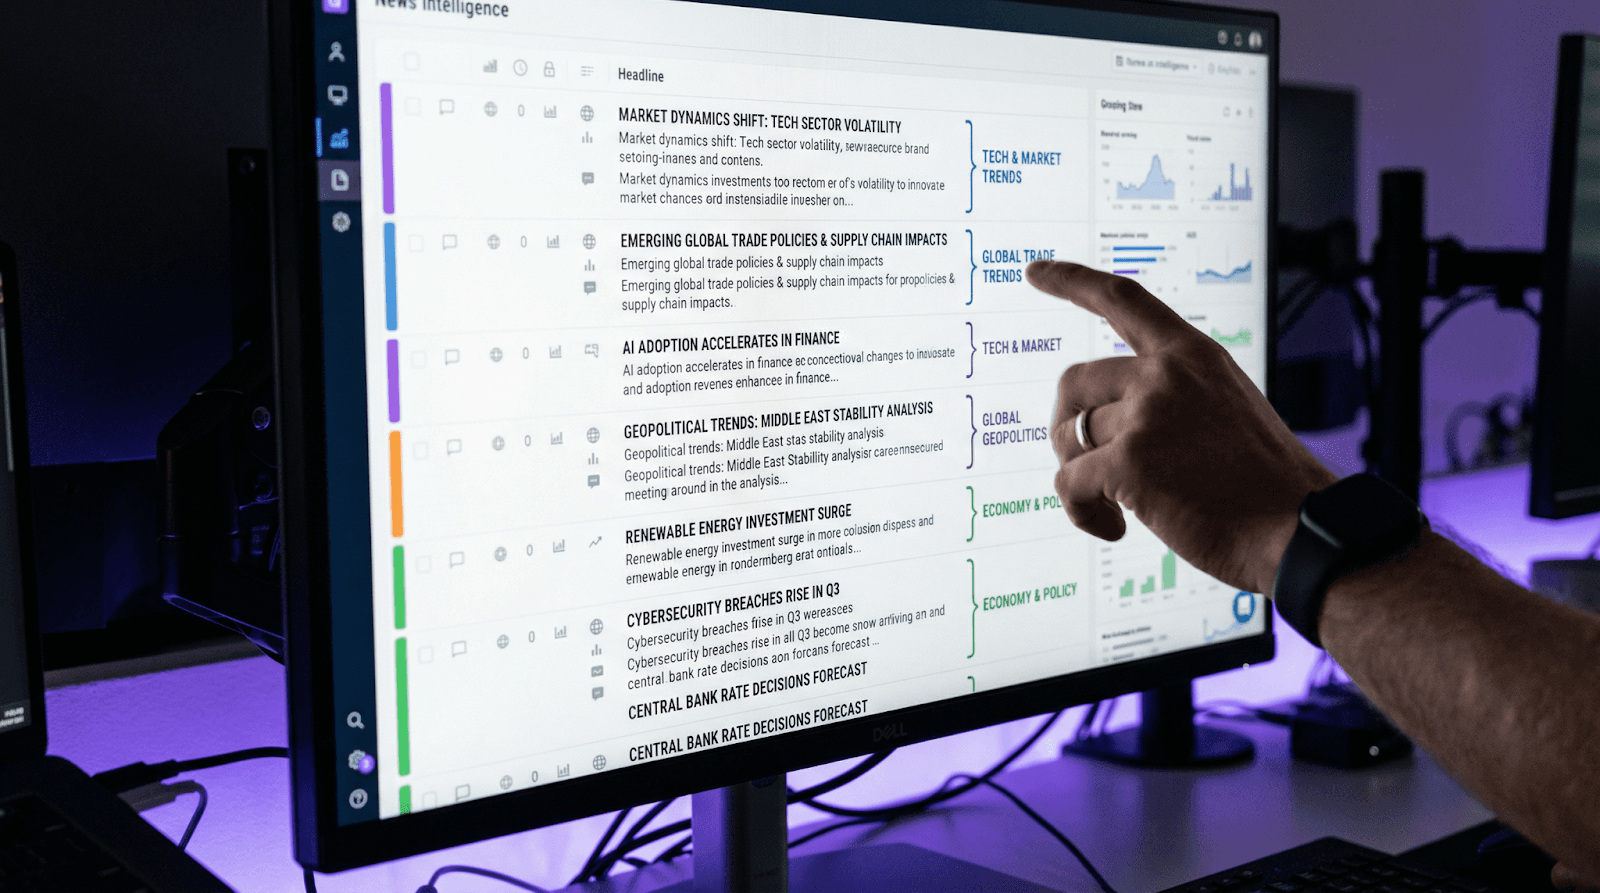
Narrative Clustering: The Metric Most Teams Are Missing
Mentions don't have meaning in isolation. Coverage only becomes strategically actionable when it's understood in narrative context—not as individual data points, but as grouped clusters of stories that are forming and evolving around your brand.
Narrative clustering is the process of grouping related articles and coverage into coherent story threads, so communications teams can see which narratives are gaining momentum, which are fading, and which require a strategic response. Instead of reviewing 400 individual articles, a team using narrative intelligence can see that 60% of recent coverage clusters around one specific story theme—and decide whether to amplify, redirect, or respond to it.
This is the kind of insight that belongs in executive PR reporting. Not raw clip counts, but narrative-level pattern recognition that tells you what story the market is currently telling about your brand. Learn more about why narrative clusters are replacing individual mentions as the core unit of reputation measurement.
Brand-Centric Sentiment Analysis
Standard sentiment analysis is better than nothing—but it tends to miss the nuance that communications leaders actually need. Generic positive/negative/neutral scoring treats all coverage as roughly equivalent and doesn't account for the context that makes coverage meaningful.
Brand-centric sentiment goes further. It asks: is this coverage prominent or passing? Was it a headline feature or a brief mention in a roundup? Is the source a tier-one publication that shapes industry conversation, or a low-authority outlet unlikely to influence stakeholders? How does the sentiment in this coverage affect your specific brand positioning, rather than applying a generalized score?
A sophisticated communications platform captures these distinctions. Publication tiering based on domain authority and readership, social shares per article that show actual amplification (not just potential reach), and brand prominence tagging that distinguishes between headline coverage and incidental mentions—these are the building blocks of sentiment analysis that's actually useful for strategic decision-making. This is exactly where modern media reporting software earns its keep versus a basic monitoring tool.
Dynamic Share of Voice
Share of voice has been a standard PR metric for years, but the way most tools implement it leaves significant intelligence on the table. Static share of voice calculations—typically percentage of total coverage volume—don't capture how competitive positioning is shifting in real time, which narratives are driving changes in relative standing, or where a brand is gaining or losing ground in specific issue areas.
Dynamic share of voice tracks competitive positioning across narratives, not just overall mention volume. This means a communications team can see not just that their brand has 34% share of voice in their category, but that they've lost ground in conversations about sustainability over the past 30 days, while competitors have made coverage gains in that specific narrative cluster.
That level of granularity transforms share of voice from a vanity metric into a genuine strategic instrument. Modern PR analytics platforms designed for enterprise communications leaders make this kind of dynamic competitive intelligence accessible without requiring a team of analysts to generate it.
LLM Perception Tracking
This is the metric category that most PR reporting tools don't yet offer, but that forward-looking communications teams are prioritizing heading into 2026. When a potential customer, investor, or journalist asks an AI assistant a question about your brand, industry, or category—what does the AI say?
The answer matters more than most organizations currently recognize. LLMs like ChatGPT, Claude, and Gemini synthesize their responses primarily from earned media: the news articles, research reports, and editorial coverage that forms the foundation of their training data and real-time retrieval. The narratives your brand earns in media coverage shape how AI systems describe and contextualize your brand when someone asks.
LLM perception tracking monitors how AI systems are representing your brand and identifies which narratives are most heavily influencing those representations. It gives communications teams a new visibility layer—one that's increasingly critical as AI-driven search becomes a primary research tool for the audiences brands most want to influence.
Impact Score and Coverage Quality Metrics
Modern executive PR reporting should replace clip count headlines with impact scoring—a composite metric that weighs coverage quality, narrative prominence, audience reach, and sentiment in a single, executive-readable number.
An impact score gives leadership a fast answer to the question that matters most: is this period's coverage working for us or against us? It synthesizes the dimensions that require expert human interpretation into something legible without requiring a full briefing to contextualize.
Supporting that score, a complete PR dashboard should include publication tiering breakdowns, which reveal whether coverage is clustering in high-authority outlets that drive industry opinion, or lower-tier publications that generate volume without influence. The difference between 100 clips in tier-one publications and 100 clips in mid-tier blogs is enormous strategically—and basic coverage volume metrics don't capture it.
PR Dashboard Comparison: Then vs. Now
The shift from legacy monitoring tools to next-generation narrative intelligence platforms represents a fundamental change in what PR measurement is actually for.
Capability | Legacy PR Dashboards | Modern Narrative Intelligence |
Core unit of measurement | Individual mentions/clips | Narrative clusters |
Sentiment analysis | Generic positive/neutral/negative | Brand-centric, weighted by prominence |
Share of voice | Static volume percentage | Dynamic, narrative-specific tracking |
Reporting cadence | Monthly or quarterly | Real-time with historical trending |
Data sourcing | Boolean keyword search | AI-powered newsfeed with auto-enrichment |
LLM visibility | Not tracked | Active monitoring and optimization |
Executive output | Clip reports and summaries | Strategic impact scores and narrative intelligence |
Time to insight | Days to weeks | Hours or real-time |
The shift isn't about having more data—it's about having intelligence that's actually usable at the moment decisions need to be made. Understanding what media intelligence really means for modern PR strategy is the first step toward upgrading how your team reports and acts on coverage.
A Sample PR Reporting Dashboard Walkthrough
What does a high-functioning PR reporting dashboard look like in practice? Here's a walkthrough of the modules that belong at the top of any enterprise communications view.
Top-Level Executive Summary Panel
The dashboard should open with the metrics an executive or senior director can absorb in 30 seconds: current impact score, 7-day and 30-day trend lines, and an indicator of whether key narratives are trending positively or require attention. No clip counts at the top—those belong further down.
Narrative Cluster Map
Below the executive summary, the most strategically valuable view in any modern PR dashboard is the narrative cluster map. This shows the major story threads currently active around your brand, their relative volume and momentum, their sentiment trajectory, and how they're evolving over time. At a glance, communications leaders can see which narratives are defining their brand right now and which require active management.
Competitive Intelligence Module
Dynamic share of voice visualized across key narrative categories, not just overall. Which competitors are gaining ground in specific conversations? Where is your brand outperforming in narrative quality, even if it's behind in raw volume? This is the kind of competitive intelligence that should be informing campaign and message strategy—and it needs to be accessible without generating a custom report.
Publication Tier Breakdown
Not all coverage is equal, and the dashboard should make that clear visually. Tier-one coverage in high-authority publications that set the agenda for your industry is fundamentally different from lower-tier coverage. A publication tiering breakdown that shows where your coverage is concentrating—and whether it's moving toward or away from the outlets that matter—is essential for strategic planning.
LLM Perception Snapshot
An increasingly important module is the AI perception panel, which shows how major LLMs are currently representing your brand and which narratives they're drawing on most heavily. As AI-generated summaries become a primary information channel for senior decision-makers and research-oriented audiences, this snapshot becomes part of any complete reputation picture.
The Metrics That Should Drive Executive PR Reporting
Most communications leaders agree that executive stakeholders don't want to see clip counts. What they do want—and what a modern PR reporting tool should make possible—is a clear picture of how communications activities are affecting brand position, competitive standing, and the narratives that drive perception.
Here are the core metrics that belong in executive PR reporting, organized by strategic value:
Narrative momentum indicators: Which story clusters are forming, growing, peaking, or declining around your brand? Are key message themes gaining coverage velocity, or losing ground to competing narratives?
Brand-centric impact score: A synthesized measure of coverage quality that accounts for prominence, sentiment, publication authority, and amplification—the "so what" behind the clip count.
Share of voice by narrative: Competitive positioning measured at the story level, not just volume, showing where your brand is winning and where it's at risk.
LLM representation score: How AI systems are currently describing your brand, and which narratives they're drawing on most heavily when responding to queries about your category.
Publication tier distribution: Percentage of coverage in tier-one versus lower-authority outlets, trending over time.
Narrative sentiment trajectory: Not just current sentiment, but whether the tone of coverage in key narrative clusters is improving, stable, or declining.

Checklist: Is Your PR Reporting Tool Ready for 2026?
Use this as a quick evaluation of your current media reporting software and dashboard capabilities:
✓ | Capability Check |
☐ | Does your dashboard surface narrative clusters, not just individual mentions? |
☐ | Can you see dynamic share of voice by narrative topic, not just overall volume? |
☐ | Does your sentiment analysis account for brand prominence and publication authority? |
☐ | Is coverage data automatically enriched (social shares, domain authority, brand prominence tagging)? |
☐ | Can you access insights in real time—not just in weekly or monthly reports? |
☐ | Does your tool track how AI systems like ChatGPT or Perplexity describe your brand? |
☐ | Are executives getting an impact score or equivalent, rather than clip count summaries? |
☐ | Can you see publication tier breakdowns for each coverage period? |
If you're checking fewer than five of these boxes, your current PR reporting tools are leaving strategic intelligence on the table.
Frequently Asked Questions About PR Reporting Tools
What metrics should always appear in an executive PR report?
At minimum, executive PR reports should include an impact score or equivalent quality-weighted coverage measure, share of voice data versus key competitors, narrative theme analysis showing which stories are shaping brand perception, sentiment trend lines, and publication tier breakdowns. Clip counts and raw impressions are secondary—useful context, but not the lead metric. Learn more about the seven PR analytics that matter most to senior communications leadership.
How often should PR dashboards be updated?
Real-time or near-real-time updating is the standard in modern PR reporting tools—particularly for narrative clustering and share of voice data. Weekly digest summaries are appropriate for leadership distributions. Quarterly reports remain useful for board-level presentations and budget planning, but they should supplement real-time intelligence, not replace it. Waiting for quarterly cycles to understand how your brand is being positioned is too slow for effective reputation management.
What is LLM monitoring and why does it matter for PR measurement?
LLM monitoring tracks how AI systems—like ChatGPT, Gemini, and Claude—describe your brand in response to queries. Because these systems synthesize primarily from earned media, the narratives your brand earns directly influence how AI presents you to anyone who asks. As AI-powered search becomes a primary research channel, monitoring and optimizing for LLM perception is becoming a core function of modern reputation engineering—not a future consideration.
How is narrative intelligence different from traditional media monitoring?
Traditional media monitoring answers "what happened"—it tracks mentions and generates coverage reports. Narrative intelligence answers "what's forming"—it clusters coverage into story threads, tracks their momentum and sentiment, maps competitive positioning, and surfaces strategic insights in real time. The difference is the gap between documentation and decision-making. Understanding what media intelligence means for modern PR teams is a good starting point for communications leaders evaluating their current tools.
Stop Reporting on the Past. Start Engineering Your Reputation.
The metrics that belong in a modern PR dashboard aren't complicated—but they are fundamentally different from what most teams are still using. Narrative clusters instead of clip counts. Brand-centric sentiment instead of generic scoring. Dynamic competitive intelligence instead of static share of voice. Real-time intelligence instead of quarterly summaries. And increasingly, LLM perception tracking that extends visibility into the AI systems shaping what your audiences believe.
The communications leaders who will define their brands' reputations in 2026 are the ones who treat PR reporting as a strategic intelligence function—not a documentation exercise. The tools to do that exist. The complete picture of modern PR measurement has shifted, and the gap between legacy dashboards and next-generation intelligence is widening every quarter.
Handraise was built from the ground up as the next-generation communications intelligence platform for enterprise brands—combining patented narrative clustering technology, brand-centric sentiment analysis, dynamic share of voice, publication tiering, and LLM impact tracking in a single real-time dashboard. If your current PR reporting tools are still delivering quarterly clip reports while the narratives defining your brand form in real time, it's time to see what genuine reputation intelligence looks like. Book a demo and start engineering your reputation—not just tracking it.
Matt Allison
Founder & CEO
Share


